> ## Documentation Index
> Fetch the complete documentation index at: https://docs.bricks.tools/llms.txt
> Use this file to discover all available pages before exploring further.

# Local debugging

> Connect Chrome DevTools and access MCP endpoints on the local network

BRICKS Foundation implements the Chrome DevTools Protocol (CDP), providing a frontend-like debugging experience for your applications. Connect via Chrome DevTools to inspect the DOM, debug JavaScript, profile performance, and view console logs. You can also connect CDP-supported tools like Puppeteer or Playwright to write automation scripts or connect via AI agents. An MCP endpoint is also provided for AI agent integration.

## On by default

On BRICKS Foundation 2.25 and later, local debugging is **on by default** — the DevTools server starts at boot with no setup, listening on the local network on port `19851`. If that port is already in use, it increments to the next available port.

To review or change the controls, open **Settings** on the device and navigate to the advanced settings section:

* **Enable local debugging** turns the server on or off entirely. Turn it off to stop the server.
* **Enable Chrome DevTools Protocol (CDP)**, **Enable Model Context Protocol (MCP)**, and **Enable LAN Discovery** are sub-toggles, all on by default.
* **Passcode** is optional — set it only when you want to require a passcode for access.

<Info>
  Requires BRICKS Foundation **2.25** or later. On older versions the server is opt-in — enable **Chrome DevTools** manually in advanced settings.
</Info>

## Discover devices

Use the [BRICKS CLI](/cli) to scan your local network for devices with DevTools enabled:

```bash theme={null}
bricks devtools scan
```

<Info>
  Devices must have **Enable LAN Discovery** turned on in advanced settings for network scanning to work. This is enabled by default.
</Info>

## Authentication

DevTools access is scoped to the device's workspace. Clients authenticate with either a workspace token or an optional device passcode.

### Workspace tokens

Any member of the device's workspace can connect using a **DevTools workspace token** — an Ed25519-signed token that is distinct from the [Workspace API Token](/controller/workspaces). The [BRICKS CLI](/cli) and CTOR Desktop acquire and refresh these tokens automatically, so signed-in workspace members usually connect without any extra steps.

To issue or refresh a token manually, run:

```bash theme={null}
bricks devtools issue-token
```

Tokens have a default lifetime of 30 days. The CLI caches the token per profile and workspace in `~/.bricks-cli/config.json` (it is never printed), reuses it until it nears expiry, and re-issues automatically if a request returns `403`.

### Optional passcode

A device also accepts a passcode, but only when one is explicitly set in [advanced settings](/foundation/settings#local-debugging). There is no default passcode. As a one-time migration, a device that had local debugging explicitly enabled before upgrading to 2.25 but no passcode keeps the legacy `BRICKS_DEVTOOLS` passcode so existing access keeps working.

Clients can present either credential — over the WebSocket path `/ws/<credential>`, as a query parameter, or as an `Authorization: Bearer <token or passcode>` header for MCP. When both are available, a workspace token takes precedence over a passcode.

### Auth state

`bricks devtools scan` and `bricks devtools open` show an auth state for each device:

| State           | Meaning                                                        |
| --------------- | -------------------------------------------------------------- |
| `workspace-jwt` | Workspace-token authentication is available                    |
| `passcode`      | A passcode is set on the device                                |
| `locked`        | A credential is required but none of yours works               |
| `open`          | No credential required (older BRICKS Foundation versions only) |

`bricks devtools open --info` also reports whether workspace authentication is enabled.

## DevTools endpoints

Once you find a device, use `bricks devtools open` with the `--info` flag to view all available endpoints:

```bash theme={null}
bricks devtools open <device-address> --info
```

This displays connection URLs for:

| Endpoint    | Description                                                                              |
| ----------- | ---------------------------------------------------------------------------------------- |
| **Web UI**  | Open this URL in your browser to access the DevTools landing page                        |
| **CDP**     | Chrome DevTools Protocol endpoint for direct connection                                  |
| **MCP**     | Model Context Protocol endpoint for AI agent integration                                 |
| **MCP SSE** | MCP endpoint using Server-Sent Events transport                                          |
| **Info**    | JSON metadata endpoint at `/devtools/info` describing the device, version, and protocols |

With `--info`, the output also includes the authorization details for whichever credential applies. The MCP and MCP SSE endpoints accept an `Authorization: Bearer <workspace token or passcode>` header.

Without `--info`, the command shows server identity (name, version, device ID, workspace, protocols, and authentication state).

### Open the DevTools page

Open the **Web UI** URL in your browser to access the DevTools landing page. From there you can inspect the running application, view available debug targets, and connect to the device.

### Connect with Chrome

You can also connect directly through Chrome:

1. Open `chrome://inspect` in Chrome
2. Your device appears in the list of remote targets — the `/json` discovery endpoints are always served, so no setup is required
3. Click **inspect** to open a DevTools window connected to the running application

If the device has a passcode, enable **Expose passcode to chrome://inspect** in [advanced settings](/foundation/settings#local-debugging) so Chrome can connect without a prompt.

<Warning>
  **Expose passcode to chrome://inspect** embeds the configured passcode into the public `/json` URLs in plain text. Only enable it for debugging on trusted networks.
</Warning>

### Inspect via BRICKS CLI (CDP)

<Info>
  Requires BRICKS Foundation version **2.24** or later.
</Info>

The [BRICKS CLI](/cli) provides CDP commands to inspect devices directly from the terminal — without opening a browser:

```bash theme={null}
# Print the brick component tree
bricks devtools brick tree -a <device-address>

# Capture a screenshot
bricks devtools screenshot -a <device-address> -o screenshot.png

# Evaluate a JavaScript expression
bricks devtools runtime eval -a <device-address> "document.title"

# Monitor network activity
bricks devtools network list -a <device-address>
```

Signed-in workspace members need no extra flags — the CLI acquires a workspace token automatically. Use `--passcode` only to reach a passcode-protected device whose workspace you are not a member of. See the [CLI command reference](/cli/commands#devtools-cdp-commands) for the full list of CDP commands.

## What you can do with DevTools

A connected DevTools window looks like a browser's, but BRICKS Foundation is not a web page — each panel projects the device's live runtime instead. Four panels are wired up and meaningful: **Elements**, **Console**, **Network**, and **Application**. Other panels (Sources, Performance, Memory, and the inspect-element button) are hidden because there is no web page behind them.

### Elements — the Brick tree
<Frame>
  <img className="block dark:hidden" src="https://mintcdn.com/bricks-207cc1f2/14EfWWl_W0enCa3o/images/foundation/elements-light.webp?fit=max&auto=format&n=14EfWWl_W0enCa3o&q=85&s=4538b96005a06765d77add9cf23b599b" alt="DevTools Elements panel showing the BRICKS render tree as a DOM document" width="1600" height="827" data-path="images/foundation/elements-light.webp" />

  <img className="hidden dark:block" src="https://mintcdn.com/bricks-207cc1f2/14EfWWl_W0enCa3o/images/foundation/elements-dark.webp?fit=max&auto=format&n=14EfWWl_W0enCa3o&q=85&s=aa67aa7af66515329bb7989c96a3b29e" alt="DevTools Elements panel showing the BRICKS render tree as a DOM document" width="1600" height="833" data-path="images/foundation/elements-dark.webp" />
</Frame>

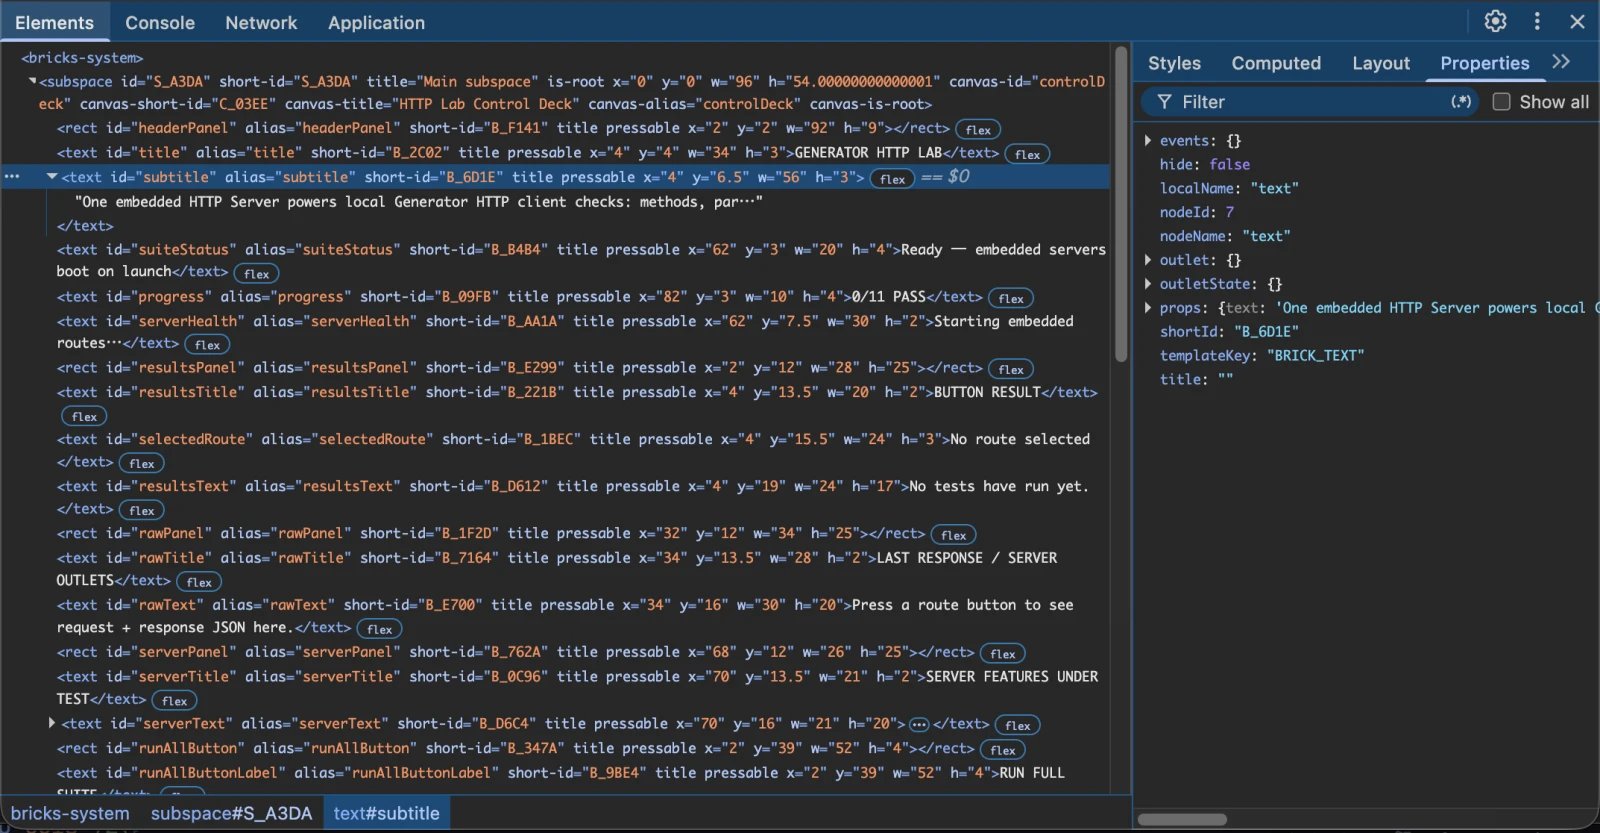
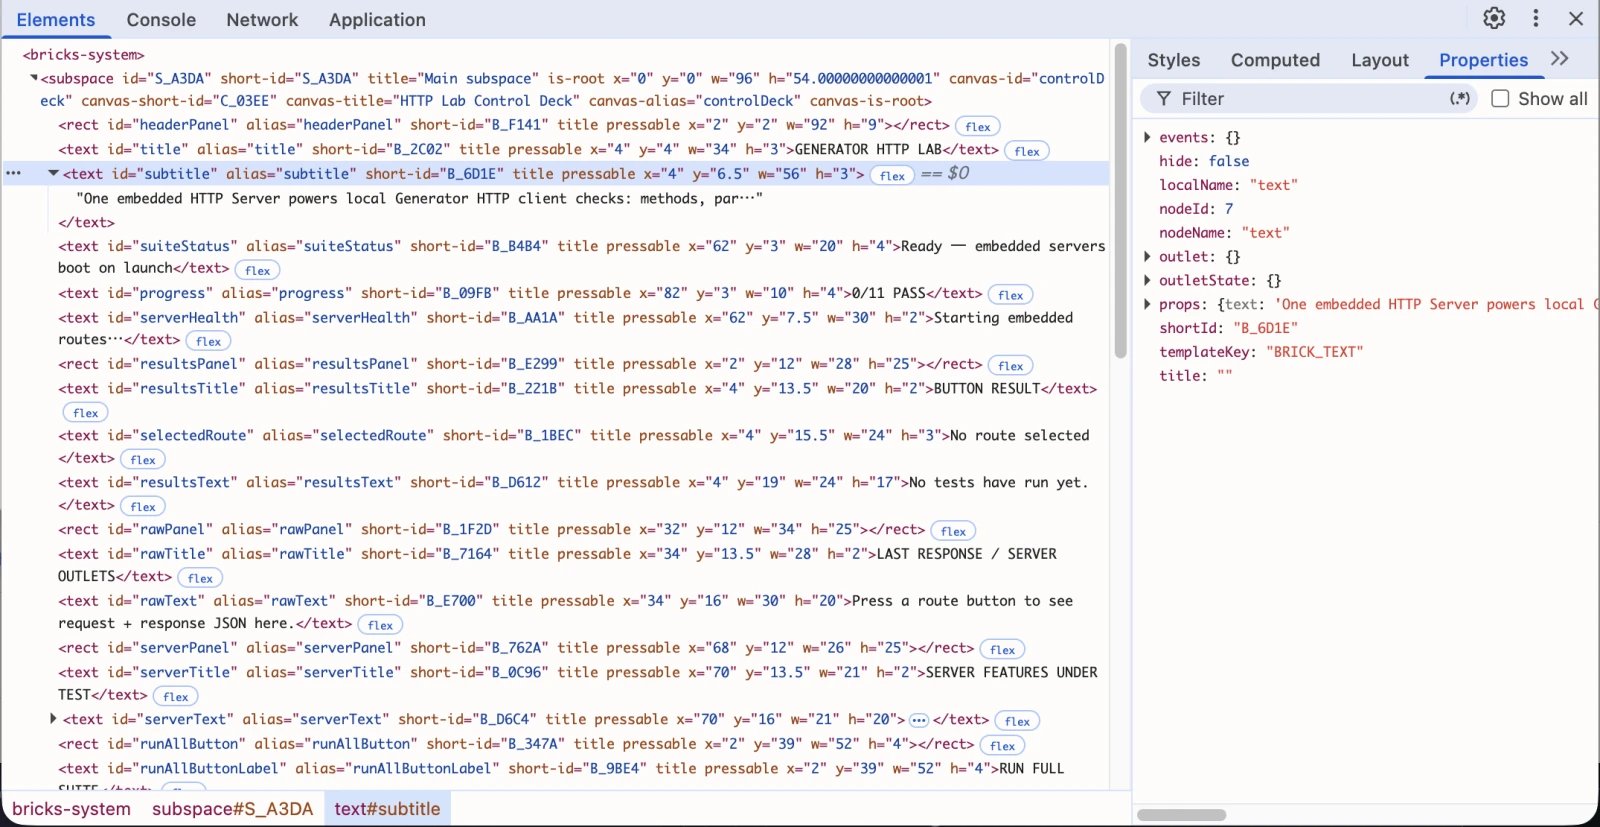
The Elements panel shows your application's **render tree** projected as a DOM document. The tree is rooted at `#document` and nests the structures you build in BRICKS:

```text theme={null}
#document
└─ bricks-system
   └─ subspace          ← one per rendered Subspace
      ├─ text           ← one element per Brick on the current Canvas
      ├─ image
      └─ subspace       ← nested Subspace
```

* Each **Subspace** is a `<subspace>` element. The Canvas that is currently displayed is merged into it, so its Bricks appear directly as children — there is no separate `<canvas>` node — and `canvas-*` attributes (`canvas-id`, `canvas-title`, …) describe which Canvas is showing.
* Each **Brick** is one element whose tag name is the Brick type with the `BRICK_` prefix removed — for example `<text>`, `<image>`, `<text_input>`, `<video>`, `<chart>`, `<items>`, `<webview>`, `<qrcode>`.
* A Brick's primary content appears as the element's text — a Text Brick shows its string, an Image Brick shows its source path (long values are truncated).

Only the **currently rendered Canvas** of each Subspace is shown; Bricks on the Subspace's other Canvases are not in the tree. **Generators** and **Data** do not appear in Elements — find Generator traffic in the **Network** panel and stored Data in the **Application** panel.

Read a Brick's identity and layout from its attributes:

| Attribute                   | Meaning                                                                                                        |
| --------------------------- | -------------------------------------------------------------------------------------------------------------- |
| `id` / `alias` / `short-id` | Identifiers. Short IDs are prefixed by type: `B_` Brick, `S_` Subspace, `C_` Canvas, `D_` Data, `G_` Generator |
| `title`                     | The Brick's title in the editor                                                                                |
| `pressable` / `editable`    | Whether the Brick responds to taps / accepts text input                                                        |
| `hide`                      | Whether the Brick is hidden                                                                                    |
| `x` / `y` / `w` / `h`       | Position and size in BRICKS **grid units** (not pixels)                                                        |

Selecting a Brick shows its attributes inline and its resolved runtime state in the side panel — the **Properties** tab exposes the Brick's `props`, `events`, `outlet`, and `templateKey`, while **Styles** and **Computed** show its synthesized layout. Hovering or selecting a node **highlights the matching Brick or Subspace on the device**, with a label such as `text — WelcomeHeader`.

Search the tree from the Elements search box with BRICKS-aware selectors:

* `#welcome-text` or `#B_3` — match by alias or short ID
* `:pressable`, `:editable`, `:hidden` — match by capability or state
* `.MyStateGroup` — match Bricks belonging to a state group

<Note>
  The Elements tree is **read-only** — editing attributes or removing nodes does not change the running app, and edits revert. To drive the app, use the `system` helpers in the Console (below) or a CDP automation tool.
</Note>

### Console — runtime logs and the `system` helpers

<Frame>
  <img className="block dark:hidden" src="https://mintcdn.com/bricks-207cc1f2/14EfWWl_W0enCa3o/images/foundation/console-light.webp?fit=max&auto=format&n=14EfWWl_W0enCa3o&q=85&s=80ced98558809614177f0ba0543ea70a" alt="DevTools Console panel showing the connect banner and the system helper object expanded" width="1600" height="226" data-path="images/foundation/console-light.webp" />

  <img className="hidden dark:block" src="https://mintcdn.com/bricks-207cc1f2/14EfWWl_W0enCa3o/images/foundation/console-dark.webp?fit=max&auto=format&n=14EfWWl_W0enCa3o&q=85&s=81f10d7da3cf917d64cc85e8d9e0eb0f" alt="DevTools Console panel showing the connect banner and the system helper object expanded" width="1600" height="223" data-path="images/foundation/console-dark.webp" />
</Frame>

The Console streams the **device runtime's own logs** — application output, `[System] Event:` lines when events fire, and native model (LLM/STT) logs. It is not a web page's `console.*`. Recent history replays automatically when you connect.

When you connect, BRICKS also injects a set of helper objects directly into the Console's evaluation scope. **Type them by name** — there is no `globals` prefix to write. Run `usage()` first to print the full catalog, or type `globalThis` to expand the whole tree.

| Helper                                     | What it does                                                                                                                                                                              |
| ------------------------------------------ | ----------------------------------------------------------------------------------------------------------------------------------------------------------------------------------------- |
| `info()` · `memoryUsage()` · `diskUsage()` | Device and app info, memory, and disk usage                                                                                                                                               |
| `usage()`                                  | Print the catalog of available helpers                                                                                                                                                    |
| `system.*`                                 | Inspect and drive the running app (see below)                                                                                                                                             |
| `control.*`                                | `refresh()`, `clearCache()`, `takeScreenshot()`, `checkUpdate()`, `rebindDevice('imsure')`, `externalScreen(enable)`                                                                      |
| `panel.*`                                  | Open on-device overlays — `panel.menu()`, `panel.info()`, `panel.apps()`, `panel.debug.root/data/log/cache/localSync()`, `panel.automation()`, `panel.advancedSetting()`, `panel.about()` |
| `automation.*`                             | `list()`, `run(testId, payload)`, `stop()` for E2E automations                                                                                                                            |
| `mcp.*`                                    | Call MCP server/client Generator tools, resources, and prompts                                                                                                                            |
| `tv.focusRegistry()`                       | Inspect the TV/remote focus registry                                                                                                                                                      |

`system.*` is the core of app inspection:

| Call                                                                | Returns / does                                          |
| ------------------------------------------------------------------- | ------------------------------------------------------- |
| `system.isReady()`                                                  | Whether the runtime is ready                            |
| `system.subspaces()`                                                | A snapshot of the Subspace tree                         |
| `system.querySelector(sel)` · `querySelectorAll(sel)`               | Query the **rendered** Brick tree                       |
| `system.query(sel)` · `queryAll(sel)`                               | Query the **full** instance tree                        |
| `system.simulatePress(subspaceId, brickId)`                         | Tap a Brick                                             |
| `system.simulateKeyDown(code, key, flags)` · `simulateKeyUp(...)`   | Send key input                                          |
| `system.executeAction(subspaceId, { handler, action, parameters })` | Run a Brick, Data, or Generator action                  |
| `system.data.storeList()`                                           | List Data stores                                        |
| `system.data.properties(subspaceId, { filter, command })`           | List Property Bank properties                           |
| `system.data.property(subspaceId, propertyId)`                      | Read one property value                                 |
| `system.cache.generatorCache(subspaceId, generatorId)`              | Read a Generator's cached output                        |
| `system.cache.runtimeCacheStats(subspaceId)`                        | Runtime cache statistics                                |
| `system.channel.keys()` · `subscriptions(regex)`                    | Inspect channels (pub/sub)                              |
| `system.storage.persist.global.get(key)` · `allKeys()`              | Read persistent scoped storage (`memory` for in-memory) |
| `system.localSync.isEnabled()` · `isMain()` · `summary()`           | Local Sync state                                        |
| `system.inspectEventRouting(id)` · `inspectParentCall(id)`          | Trace how events are wired                              |

```js theme={null}
usage()                                  // print the helper catalog
system.subspaces()
system.querySelectorAll(':pressable')    // every pressable Brick in the rendered tree
system.data.storeList()
system.data.properties('S_1', { command: false })
system.simulatePress('S_1', 'B_3')       // tap Brick B_3 in Subspace S_1
control.takeScreenshot()                 // renders inline in the Console
panel.debug.log(true)                    // open the on-device log panel
```

<Tip>
  IDs follow the same prefixes as the Elements panel — Subspaces `S_`, Bricks `B_`, Data/properties `D_`, Generators `G_`. Asynchronous helpers report through `[Launcher] …` log lines rather than an inline return value. Secrets (passwords, tokens, API keys) are masked as `[HIDDEN]`.
</Tip>

### Network — request traffic

<Frame>
  <img className="block dark:hidden" src="https://mintcdn.com/bricks-207cc1f2/14EfWWl_W0enCa3o/images/foundation/network-light.webp?fit=max&auto=format&n=14EfWWl_W0enCa3o&q=85&s=b94a05d0dd0f70ad7eec1f729749bbc6" alt="DevTools Network panel showing a captured HTTP request with headers" width="1600" height="723" data-path="images/foundation/network-light.webp" />

  <img className="hidden dark:block" src="https://mintcdn.com/bricks-207cc1f2/14EfWWl_W0enCa3o/images/foundation/network-dark.webp?fit=max&auto=format&n=14EfWWl_W0enCa3o&q=85&s=bba4afde4db8dd6c2389387e2358a234" alt="DevTools Network panel showing a captured HTTP request with headers" width="1600" height="729" data-path="images/foundation/network-dark.webp" />
</Frame>

The Network panel shows requests made by **Generators**, the **preload** process, and the runtime. Capture is active whenever DevTools is enabled, so requests appear even before you open the panel. How each source is represented:

| Traffic                                         | Appears as                                                                                                      |
| ----------------------------------------------- | --------------------------------------------------------------------------------------------------------------- |
| HTTP / HTTPS (HTTP Generator, internal fetch)   | Standard request rows (type **Fetch**) — method, URL, status, headers, request payload, response body           |
| Streaming / server-sent (HTTP & LLM Generators) | One **EventSource** row; open the **EventStream** tab to watch events                                           |
| WebSocket (`ws` / `wss`)                        | A **WebSocket** row; open the **Messages** tab to watch frames                                                  |
| MQTT (`mqtt` / `mqtts`)                         | A WebSocket-style row at the broker URL; each publish or received message is a frame shown as `[topic] payload` |
| Data Bank live subscription, GraphQL            | HTTP rows for queries plus a WebSocket row for the subscription                                                 |
| **Preload** (assets, fonts, Media Boxes)        | `HEAD` size probes and `GET`/`POST` downloads as the app preloads its content                                   |

For example, a Generator pointed at `mqtt://broker.example.com:1883` shows one row (status `101 Connected`); publishing `{"temp":21}` to `sensors/room1` appears in **Messages** as an outgoing frame `[sensors/room1] {"temp":21}`, and inbound messages appear as incoming frames.

<Warning>
  Network traffic is shown **verbatim and is not redacted** — `Authorization` headers, API keys in URLs, and request/response bodies are all visible. DevTools access is workspace-scoped by default, so treat it as sensitive — anyone with your workspace membership or the device passcode can see this traffic verbatim.
</Warning>

Subspaces, Canvases, Bricks, and Property Bank values have no direct Network rows — they only appear indirectly, as the source of the Generators or preload steps that make requests. Response bodies are cached for recent requests only, and connections opened before DevTools started will not appear.

<Note>
  Responses served from the runtime cache do not appear as network requests yet — surfacing runtime cache activity in this panel is planned for a future release.
</Note>

### Application — stored Data (read-only)

<Frame>
  <img className="block dark:hidden" src="https://mintcdn.com/bricks-207cc1f2/14EfWWl_W0enCa3o/images/foundation/application-light.webp?fit=max&auto=format&n=14EfWWl_W0enCa3o&q=85&s=e49c06a591cb369454cef2309a6cc4d1" alt="DevTools Application panel showing BRICKS storage projected into IndexedDB" width="1600" height="612" data-path="images/foundation/application-light.webp" />

  <img className="hidden dark:block" src="https://mintcdn.com/bricks-207cc1f2/14EfWWl_W0enCa3o/images/foundation/application-dark.webp?fit=max&auto=format&n=14EfWWl_W0enCa3o&q=85&s=2c6217ed1c45d45d062e9d52525822de" alt="DevTools Application panel showing BRICKS storage projected into IndexedDB" width="1600" height="614" data-path="images/foundation/application-dark.webp" />
</Frame>

The Application panel projects the device's runtime storage into the browser's storage buckets, all under a single origin `bricks://app`:

| DevTools location                        | BRICKS data                                                                                                            |
| ---------------------------------------- | ---------------------------------------------------------------------------------------------------------------------- |
| **Local Storage**                        | Persistent scoped storage (survives restarts), keyed `global:<key>` and `subspace:<id>:<key>`                          |
| **Session Storage**                      | In-memory scoped storage (cleared on reset)                                                                            |
| **IndexedDB → `GENERATOR_CACHE`**        | Cached Generator outputs                                                                                               |
| **IndexedDB → `GENERATIVE_MEDIA_CACHE`** | Cached generative-media results                                                                                        |
| **IndexedDB → `DATA-<subspace>`**        | Per-Subspace **Property Bank** values (store `properties`); rows prefixed `[persist]` are the persisted backing copies |

<Note>
  A `DATA-…` database holds the runtime **Property Bank**, which is distinct from the [Data Bank](/controller/data-bank) storage product in [BRICKS Controller](/controller). Likewise, `GENERATIVE_MEDIA_CACHE` is a runtime cache, not Media Box or Media Flow.
</Note>

The Application panel is **read-only** — values cannot be edited from DevTools; change them in the app instead. Object values update live as the app runs, and secrets are masked as `[HIDDEN]`.

## Next steps

<CardGroup cols={2}>
  <Card title="Remote debugging" icon="tower-broadcast" href="/foundation/remote-debug">
    Debug devices remotely via BRICKS Controller without local network access.
  </Card>

  <Card title="Debug panel" icon="bug" href="/foundation/debug-panel">
    Use the on-device overlay to inspect runtime state.
  </Card>
</CardGroup>